Bitcoin’s history of bull market drawdowns
The most brutal drawdowns have historically happened at the tail end of bull runs

ImageFlow/Shutterstock modified by Blockworks
This is a segment from the Empire newsletter. To read full editions, subscribe.
Bitcoin’s wild price swings have beaten us all into submission.
We naturally expect enormous corrections to crush hopes, dreams and wallet balances, even in the midst of monster bull runs.
So, you’d be forgiven for expecting a sudden 50% collapse in the price of bitcoin on its way to six figures and beyond.
Is it warranted?
First, to be clear: bitcoin does have a habit of tanking by about 80% from bull run peak to bear market trough. It has happened every cycle going right back to its first major rally in 2011.
But this column isn’t about bear market drawdowns (here’s our previous analysis on the topic). Instead, it’s about the corrections that happen specifically during bull markets, like the one we’re in right now.
The charts below plot bitcoin’s price performance across six different timeframes, ranging from three days to three months, on a rolling basis, starting when the cycle starts (the trough) to an all-time high (the peak).
Each line shows a different timeframe — the dark purple line shows the percentage difference between each daily low and the open three days earlier, for instance. Green does the same but over three months at a time.
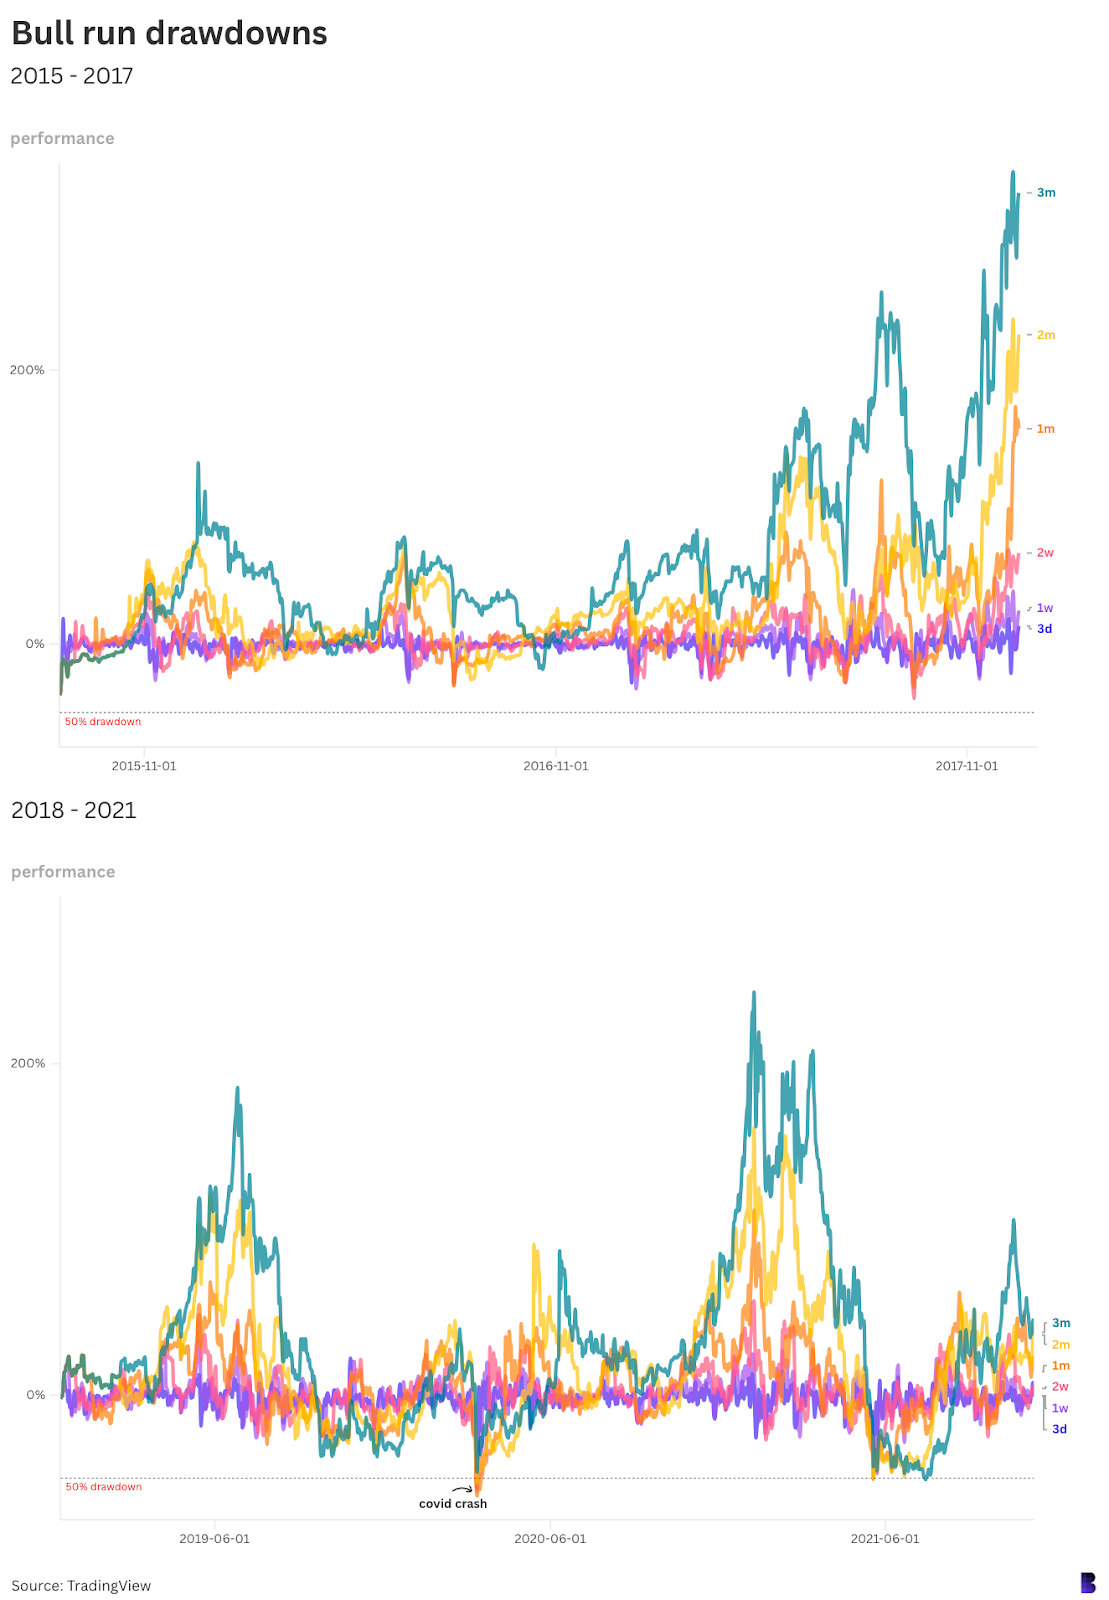
The dotted line at the bottom otherwise shows what a 50% drawdown would look like. As you can see, the bull run between August 2015 and December 2017 involved no drawdowns of that size.
During that market cycle, the largest was a 40% retracement over two weeks toward the end back in September 2017.
There were, however, three corrections of more than half during the following bull market between 2018 and 2021.
One of those was the epic covid market crash in March 2020 — which roughly coincided with a series of “Black Mondays” for the stock market.
BTC dove by half or more across every timeframe except three months, which only hit about 47%.
The other big drawdowns occurred in May and July 2021, when bitcoin dove from a then-all-time-high of over $60,000 to $30,000. It would then climb back to almost $69,000 over the next four months.
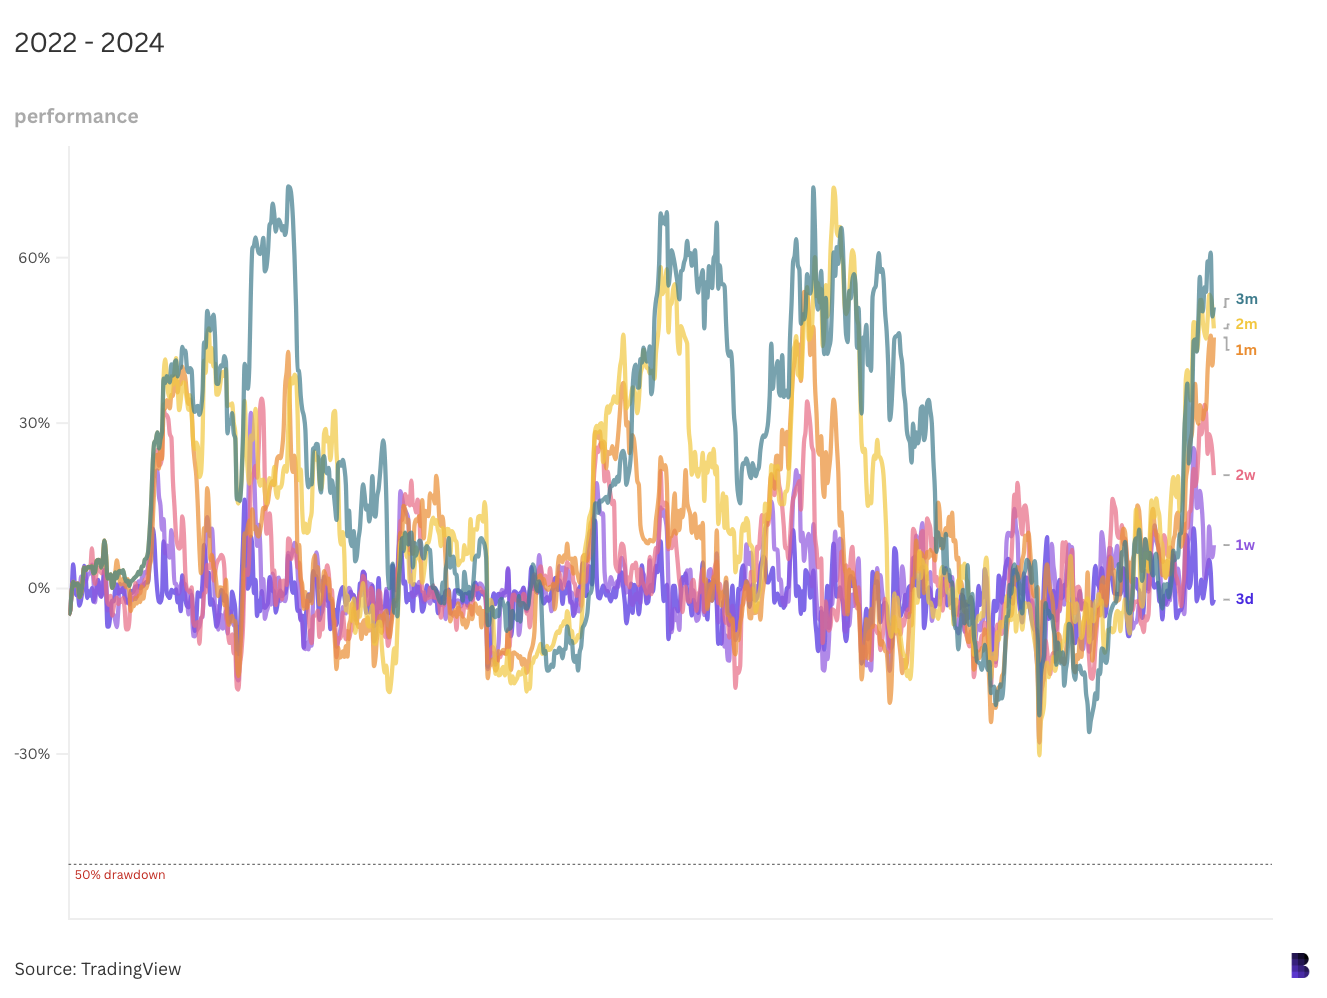
This time around has been much tamer, with the worst mid-bull correction coming in the first week of August.
Bitcoin had fallen 30% across multiple timeframes, reaching a low of $49,200 from over $70,000 in June.
All this isn’t to say that bitcoin has lost its volatility. I would still expect a rocky ride.
What’s good to know, though, is that most brutal drawdowns have historically happened at the tail end of bull runs.
So, the longer we go without one, the spookier it gets. All part of the fun.
Get the news in your inbox. Explore Blockworks newsletters:
- The Breakdown: Decoding crypto and the markets. Daily.
- 0xResearch: Alpha in your inbox. Think like an analyst.